![]()
![]()
Alcohol Use
Last modified: Feb.2000 Why This Measure?
The toll alcohol exacts on society, individual health, and the economy is staggering. Adolescents who use alcohol are much more likely than their non-using peers to experience other serious problems, both in adolescence and as adults. Whether we as a community look at injuries, traffic crashes, family dynamics, violence, or lack of success in school or the work place, alcohol is frequently lurking in the corners of the picture.
Lead Indicator
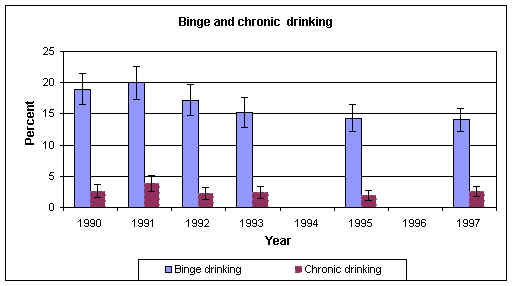
Montana 18 & Over Alcohol Use
Source: Montana BRFSS 1998 (Note: CI is the 95% confidence interval; ex. 45% +/- 3%)
For BRFSS data related to gender, race, age, income levels, and education levels check out Montana Adult Alcohol Use Demographics
-----------------------------------------------------------------------------
Trend Same Data Rating Available Reliable Relevant
Not well. The federal government estimates that 13% of the nation’s adult population has a problem with alcohol abuse. (Missoula Blue Ribbon Commission II) Of course, not everyone who sometimes drinks excessively falls into that category. But finding one reliable measure was very difficult. We chose binge drinking partly because of the kinds of problems that tend to follow from a binge drinker’s impaired thinking — traffic crashes, unsafe sex, displays of temper — whether or not the drinker has an ongoing problem with alcohol. Men (22%) are more likely to binge drink than women (7%).(Montana BRFSS 1998)
Related Measures Nearly all the Children, Youth, Families
Patterns of Use/Abuse (Adults, UM Students, Pregnant Women)
Adults
58% of Missoula adults had at least one drink in the prior month. Of those, 17% had three or more drinks a day; 2% reported drinking and driving during the past month (which comes out to about 1600 people — and that estimate is low because the survey depends on self-reporting). (Missoula BRFSS 1997)
UM Students
Of UM undergraduates, 65% reported at least one episode of binge drinking during the past 30 days. 40% had driven a car after drinking in the past 30 days. (NCHRBS Survey 1996)
Pregnant Women
Nationally, 16% of pregnant women reported drinking during the preceding month, and 4% reported frequent binge drinking. Of Montana women of childbearing age, 15% reported frequent alcohol consumption. (CDC 1997) Alcohol use during pregnancy is the leading preventable cause of birth defects. (HP 2000)
Cost to SocietySociety pays vast sums of money to contend with the damage done by its intoxicated citizens. The payments are made in the form of prisons, insurance premiums, loss of life, and damaged property. And the costs of — and to — damaged families cannot be calculated. Alcohol was involved in one out of every four family problems and one out of three failed marriages. (IUCSD Prevention File, Spring 1994)
GeneticsChemical dependency may have a significant genetic risk factor: a child’s risk of dependency is four times higher if close relatives are addicted to drugs or alcohol. (Missoula Blue Ribbon Commission II)
See Youth Substance Use Measure for extensive information on this topic
The following data are from the Montana Prevention Needs Assessment Survey (Oct. 1998). The Missoula data are from Missoula County Public Schools district. A separate youth Substance Abuse Measure is under construction.
30 Day Alcohol Use Frequency
Percent
Occasions
8th Msla
8th Mt.
10th Msla
10th Mt
12th Msla
12th Mt
0 71
72
48
54
42
46
1--2 17
15
20
20
20
20
3--5 5
6
12
11
13
13
6--9 3
3
8
7
10
9
10--more 3
4
10
9
12
12
How many times have you had 5+ drinks?
Percent
Occasions
8th Msla
8th Mt.
10th Msla
10th Mt
12th Msla
12th Mt
0 84
82
63
68
57
62
1--2 9
10
22
19
23
21
3--5 4
4
10
7
12
10
6--9 0.4
1
3
2
4
3
10--more 2
2
4
3
4
4
Home | Domestic Violence | HealthCopyright 1999-2018 Missoula County